We’ve been having fun playing with this interactive map from the 2010 Census, which provides nearly real-time updates on the mail-in participation rate by jurisdiction.
A “Mail Participation rate” is the percent of forms mailed back by households that received them. To find your area’s 2010 Census participation rate using the map, enter your zip code, or your city and state, in the search field and click the “Find” button. Once you do this, a national view of the map will appear with a data window on the exact location you chose. The mail participation rate for that area will be featured prominently within that window. From here you can either zoom in or compare that area’s 2010 participation rate to its 2000 Census participation rate.
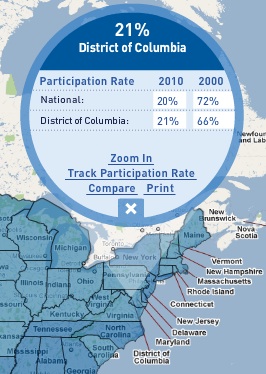
The District of Columbia’s participation rate is currently at 21 percent, just one percentage point above the national average of 20 percent. That compares with current participation rates in Maryland and Virginia, which both reached 27 percent as of today.
It’s early yet still to draw too many conclusions on how D.C. will end up faring compared the rest of the country, but in 2000, we ended up falling far short of the 72 percent national average, with a 66 percent rate of participation. So mail those forms in, D.C.! The April 1 deadline is looming, and every form mailed in saves all of us taxpayers serious money.