 Rachel Sadon
 Photo by fred king
In a delightful change of pace, we have a report that actually compares the D.C. area to other urban regions, rather than states. Less delightfully, we didn’t fare all that well in comparison.
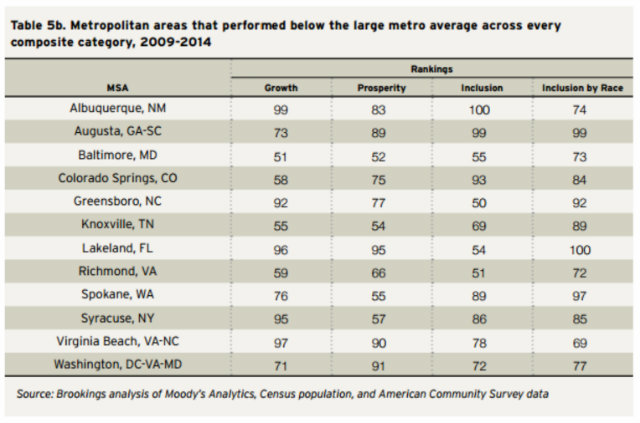
In a new study that ranked Washington-Arlington-Alexandria against 99 other Metro regions in terms of their recoveries from the Great Recession, the Brookings Institution rated D.C.’s performance as 71st in “growth,” 91st in “prosperity,” 72nd in “inclusion,” and 77th in “inclusion by race.”
The think tank’s Metropolitan Policy Program released the Metro Monitor report on Thursday with the goal of measuring cities’ economic successes in a new, more comprehensive way. To that end, the authors not only looked at economic growth from 2009 to 2014, but also how it came about and who exactly is benefiting from it.
 Courtesy of Brookings
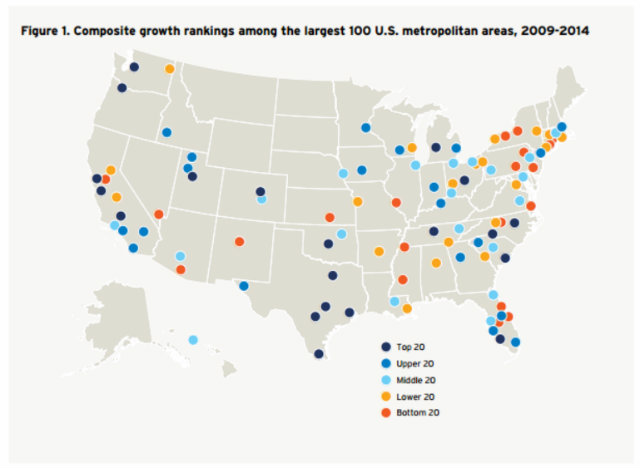
For growth, the most conventional of the categories, Brookings looked at the total number of full- and part-time jobs, gross metropolitan product (GMP, or the total value of goods and services produced), and aggregate wages to come up with how an area’s economy changed in size. With increases of 4.3-4.7 percent in each of those categories in the five years after the recession, D.C. ranked 71st. That put our recovery about on par with Fresno, Sacramento, and Youngstown.
Across the rest of the country, the report found that growth was “widespread but uneven.” Places like Austin, for example, saw nearly 20 percent job growth, but two cities (Wichita and Albuquerque) actually saw a decline.
But the report didn’t stop there. “Successful economic development strategies not only grow an economy but raise living standards for all of its residents,” Brookings senior research analyst Richard Shearer noted in a statement. The second indicator, prosperity, looked at how the “economic well-being of the region’s average workers and residents” changed over time.
In that regard, things look rather bleak for the District and its surroundings, which are one of only a few regions where all three indicators saw declines: GMP per job was down .3 percent, the average annual wage decreased by .2 percent, and the GMP per capita fell by 3.9 percent. The authors noted that the poor showing might reflect cutbacks in government spending in recent years.
 Courtesy of Brookings
The third indicator, “inclusion,” gauged whether or not that prosperity was shared across the population by looking at median wage, relative income poverty, and employment. D.C. saw the median wage fall 5.4 percent, relative poverty increase 1.2 percent, and employment stay static for a ranking of 72. A report from the D.C. Fiscal Policy Institute recently found that the wage gap between the city’s rich and poor is at a 35-year high.
An important, depressing caveat was embedded in the Brookings report: “On inclusion, a high ranking does not necessarily indicate that a metropolitan area is becoming more inclusive; indeed, it may simply not have fallen as far or as fast as its peers.”
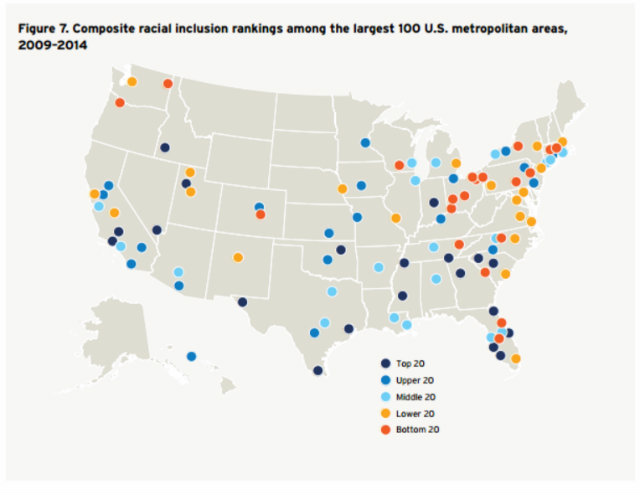
In fact, of the 100 metropolitan areas studied, only 21 saw the gap between the white population and people of color shrink significantly on all three measures. D.C., for example, saw the employment rate gap between whites and people of color increase from 4 to 6 percentage points. That contributed to the area’s paltry 77th-place ranking for “inclusion by race.”
“Race is an important aspect of our inclusion measurements,” Shearer said. “Measuring the gap between economic outcomes for whites and people of color can indicate whether access to opportunity is broadly shared in a metropolitan area.”
 Courtesy of Brookings
Overall, Washington-Arlington-Alexandria was one of 12 regions that performed below the average on all four areas of study between 2009 and 2014.
Still, it should be noted that since D.C. fared comparatively well during the recession, we had less to recover from. When looking at the same data over a ten year period, the region comes out much better, though still not great: 31st in growth, 43rd in prosperity, and 35th in inclusion.