 Photo used under a Creative Commons license with Eric Fischer.
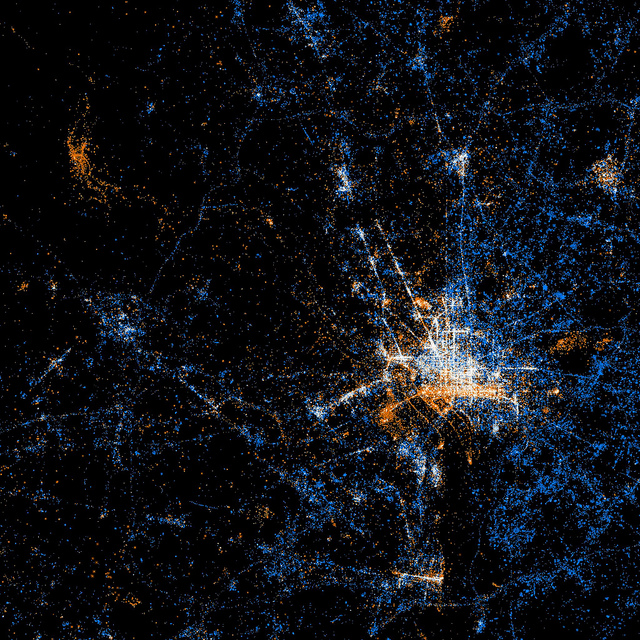
The District loves to take photos; we also love to tweet. So where around the region are people doing both? This awesome visualization by Eric Fischer answers that question — in the image, blue dots represent locations of Twitter use, while orange dots represent locations where photographs have been uploaded to Flickr. There is some interesting information to pull out of the map, for sure: check out the bunches of orange in tourist areas like the National Mall, Arlington National Cemetery, the Zoo, Great Falls or the National Arboretum; the paucity of Twitter use in parts of Northern Virginia opposed to suburban Maryland; or fun stuff, like the little orange dots that represent people taking pictures while floating on the Potomac River.
You can view the entire collection of Fischer’s visualizations of cities around the world here.