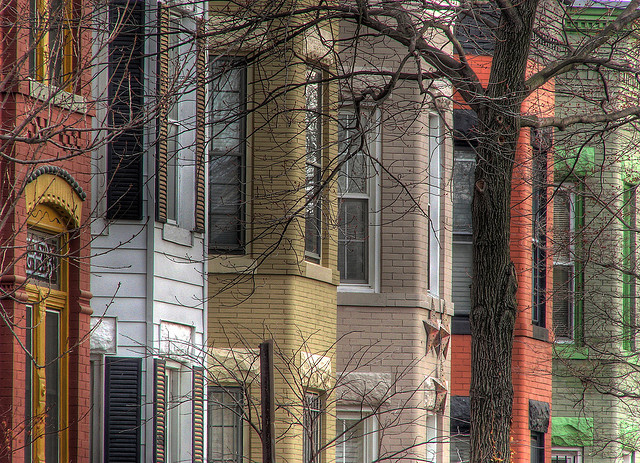
 Photo by Ronnie R
This should come as little surprise to anyone that’s been following the mayoral race this year, as its been one of the more pressing topics, but a recent study found that D.C. has one of the highest economic inequality gaps in the nation.
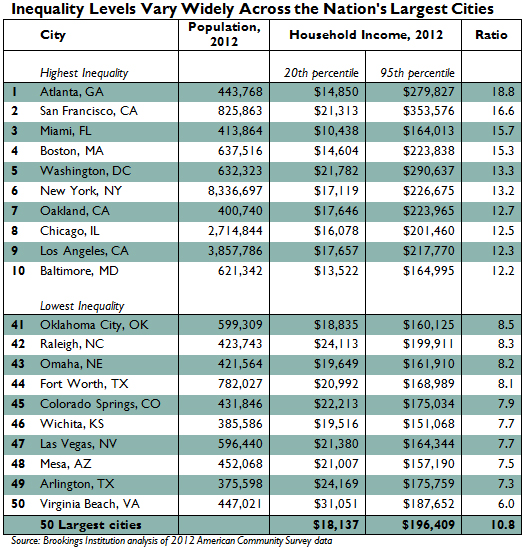
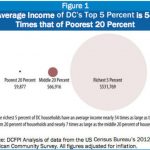
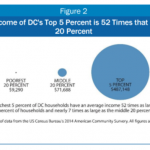
According to a recent report from the Brookings Institution, D.C. ranks fifth in cities across the U.S. with the highest inequality gap, with a ratio of 13.3. But what does that number mean? Well, that 13.3 is the result of Brookings’ metric used to determine the inequality gap in cities, called the “95/20 ratio.” The 95/20 ratio “represents the income at which a household earns more than 95 percent of all other households, divided by the income at which a household earns more than only 20 percent of all other households.” A less jargon-y explanation: The gap between households in the top five percent of average income versus households in the bottom 20 percent of average income.
By that measure, D.C. ranks fifth, right after Boston, Mass. (15.3), Miami, Fla. (15.7), San Francisco, Calif. (16.6), and Atlanta, Ga. (18.8), which took the top spot. Brookings’ data shows that in D.C., where the 2012 population was measured at 632,323, households in the 20th percentile took in an average of $21,782 a year, while households in the 95th percentile made an average of $290,637. Another interesting tidbit from that report: Of the top ten cities with the highest inequality gap, D.C.’s average household income for homes in the 20th percentile is the highest, with San Francisco in a close second.
You can take a look at the Brookings Institute’s full rankings from their study below and find a full analysis of their findings here.