 Via Urban Institute.
A new Urban Institute report finds that, not only are Americans in debt, we’re in it pretty deeply.
The non-profit looked at every American with a credit file and found that 80 percent have recorded debt, which can include mortgages. In September 2013, according to the report, “average total debt per American with a credit file stood at $53,850.”
Congrats, D.C.: Ours is higher than that. Average total debt that year in D.C. was $65,532. Average non-mortgage debt (loans, credit cards, etc.) was $15,896 and average mortgage debt was $49,635. Average total debt for the Washington, D.C. metropolitan area was $95,560 as of September 2013, while average non-mortgage debt was $18,700.
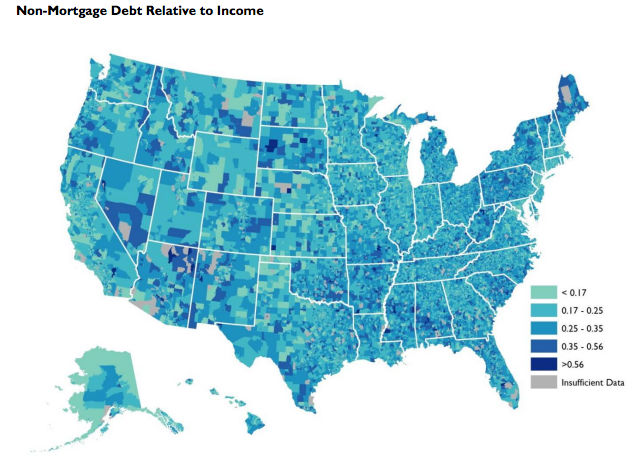
Average debt varies substantially across the United States, from less than $30,000 in many localities to more than $140,000 in others. Total debt is high along the Pacific Coast in California, Oregon, and Washington. Another prominent area is the portion of the East Coast from Washington, D.C., through Boston. It is no surprise, then, that among the nine census divisions, total debt is highest in the Pacific ($69,831) and New England ($68,401; table 1). This is followed by the Mountain division, at $59,563. The
Pacific, New England, and Mountain divisions also have the highest levels of average total debt relative to average household income. People in these areas may have higher debt because they have higher incomes or more assets, providing them with greater access to credit. The Pacific and New England divisions have relatively high housing prices, which is an important driver of total debt. Conversely, two southern divisions—East South Central and West South Central—have the lowest levels of debt ($39,137 and $39,931, respectively), along with the lowest levels of debt relative to household income.
Of the people with debt in D.C., a separate report [PDF] finds that 4.5 percent have past due debt.