Jacob Fenston
Want to know what climate change will bring, sixty years from now? To get a taste of D.C.’s future weather, no need to wait. Just hop in the car, hit the road, and drive 970 miles southwest, to Greenwood, Mississippi.
Even without taking the drive, you can probably imagine the difference. “Summers are a lot longer, they’re a lot hotter, and they’re a lot more humid,” says Matt Fitzpatrick, a professor at the University of Maryland Center for Environmental Science, and co-author of a new study published in the journal Nature Communications.
The study draws on climate projections for the year 2080 from the U.N.’s Intergovernmental Panel on Climate Change, as well as past climate data from 1960 through 1990. Comparing the two data sets, researchers found “climate analogs” for 540 cities in North America — Boston’s climate will be like Baltimore’s was in the 20th century; New York City will feel like Jonesboro, Arkansas; Minneapolis will feel like Kansas City, and San Francisco will feel like Los Angeles.
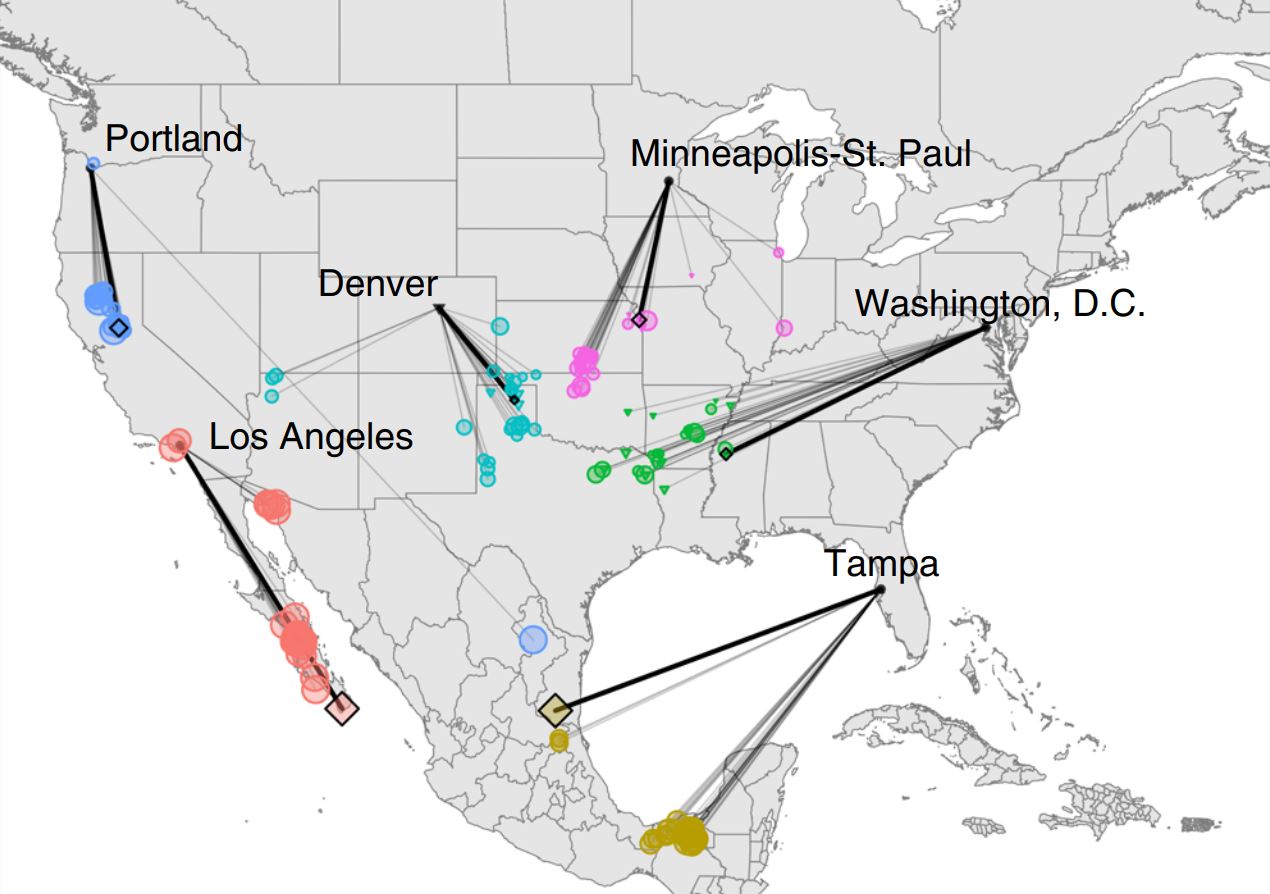
Bold lines indicate the mean of 27 individual projections, for each city’s climate analog. This map represents a high emissions future, RCP8.5.Matthew Fitzpatrick and Robert Dunn / Nature Communications
Some of those changes may seem attractive — beachgoers in San Francisco might be especially pleased. People sick of snow in D.C. might welcome balmy winters. But Fitzpatrick says that is not a good way to look at it. “We have to keep in mind that the other direct impacts of climate change on natural systems and agricultural systems are going to directly impact our lives,” he says.
On average, climates will shift 530 miles, according to the report, which includes an interactive map.
These climate analogs are based on a high emissions scenario, known as RCP8.5, that represents what can be expected with current policies and the current pace of action to reduce emissions. Researchers also found analogs based on a lower emissions scenario, RCP4.5, which would require a significant drop in global greenhouse gas emissions. To get a feel for D.C.’s possible climate future in that scenario, drive 211 miles north from Greenwood, to Paragould, Arkansas.
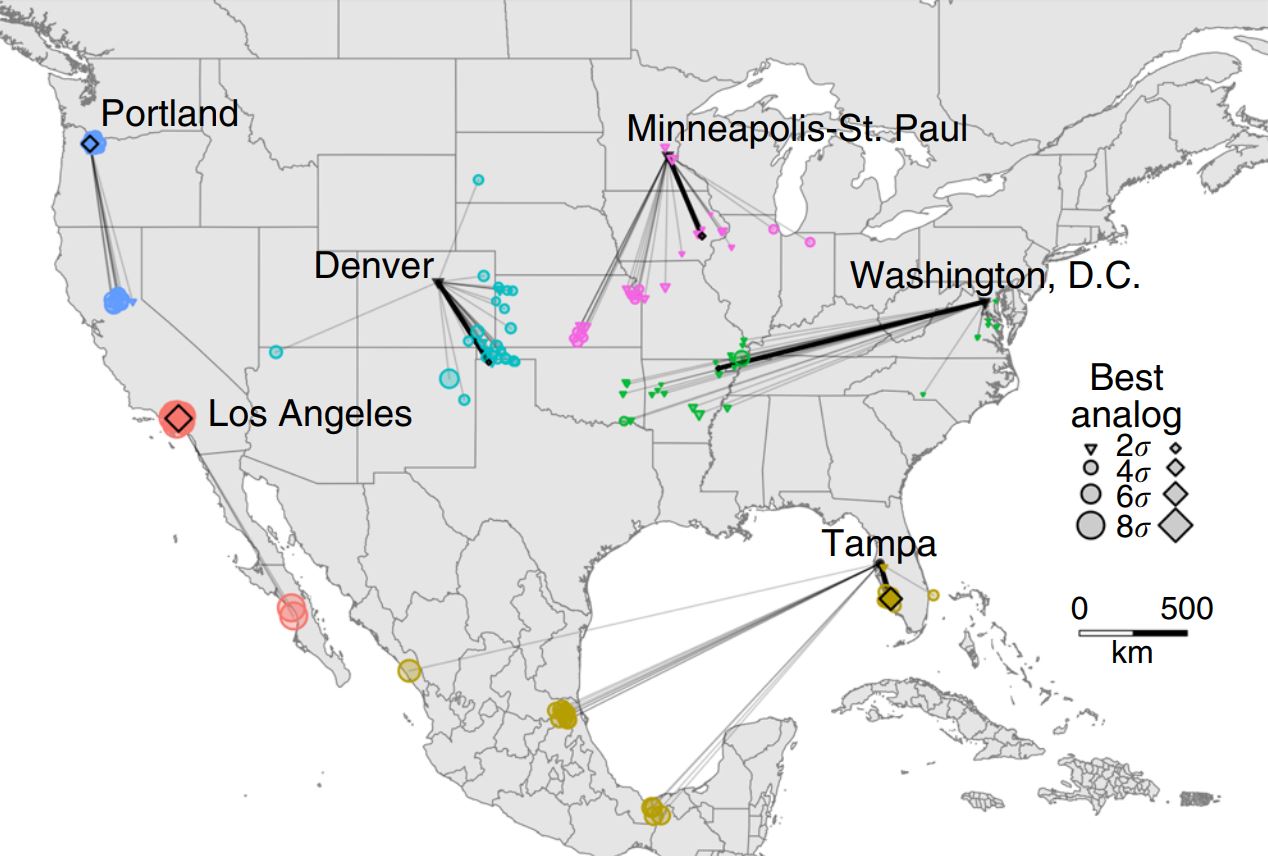
This map represents a relatively lower emissions future, RCP4.5.Matthew Fitzpatrick and Robert Dunn / Nature Communications
“While scientists share great concern for the expected severe impacts of climate change, the same is not necessarily true of the general public,” the authors write. That disconnect is related in part to a failure to communicate the science in a way the public can relate to, they write. Fitzpatrick says climate reports are often filled with measures such as projected mean global temperature rise. “Those sorts of descriptive numbers never really resonated with me,” he says. “So I was curious, is there a way we could translate what that actually means for local climate where people actually live.”
The climate analog maps created by Fitzpatrick and co-author Robert Dunn of North Carolina State University are what’s known as “forecasting by analogy,” translating abstract descriptive data into something tangible and familiar. It’s been done elsewhere, including Europe (the climate in Germany will be more like Spain; Northern Italy will be like Turkey), Australia, and the state of Wisconsin.
The goal, says Fitzpatrick, is not just to terrify people. He says the maps have a positive message too. “To me, it really demonstrates the positive impacts of reducing emissions,” he says. “We still see some substantial changes even under reduced emissions, but they are lessened.”
This story originally appeared on WAMU.