Jacob Fenston
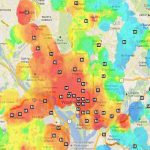
On Sunday, one of hottest days of the summer, more than 100 residents criss-crossed Montgomery County with high-tech thermometers mounted on their cars, to map out which parts of the county are the hottest. It’s part of a national effort to better understand urban heat islands, and focus more resources on areas that are sweltering.
It’s no surprise that a residential street with mature trees blocking out the sun will feel cooler than somewhere dominated by asphalt and concrete. But it may be surprising just how big the difference can be: similar research conducted in D.C. in 2018 found the hottest areas of the city were 17 degrees warmer than the coolest areas on the same day. In D.C. and elsewhere, the hottest areas are often low income communities and communities where more residents of color live.
“Typically they’re in areas that have been historically redlined,” says Morgan Zabow, climate and health communications coordinator with the National Oceanic and Atmospheric Administration, which is funding the project in Montgomery County and 13 other communities around the nation. NOAA has funded urban heat island mapping in 35 communities over the past five years.
Urban heat islands can be as much as 20 degrees hotter than surrounding areas, Zabow says. And the heat can stick around, even after the sun goes down.
“Roads and buildings that gain heat during the day radiate that heat back into the surrounding air,” Zabow explains.
In Montgomery County, 115 citizen scientists fanned out on Sunday, aiming to take temperature readings covering an area of 200 sq. miles, including Silver Spring, Gaithersburg, Germantown, Rockville, Fairland, and Olney.
The volunteers covered 19 predetermined, hour-long routes, repeating the trip at 6 a.m., 3 p.m., and 7 p.m., to capture temperature change over time, and see which areas retained the most heat. They used data monitoring sensors to record temperature, humidity and location once every second.
Laura Sivels, climate engagement program manager with Montgomery County, says she was astounded by the interest in volunteering — she had to turn away 500 residents who wanted to participate.
“I did very little in recruiting people. People came organically on their own,” Sivels says. “People understand the heat, they feel the heat in their communities. They want to do something about it, they understand that this is going to get worse.”
After capturing the data, the sensors are sent to CAPA Strategies, a company that is partnering with NOAA on the project. CAPA will then produce high resolution maps of Montgomery County, showing the hottest and coolest places. Those are expected to be released within the next two months.
It’s not just about finding the most comfortable locale: extreme heat is dangerous, killing more people in the U.S. than any other type of weather. And some people are disproportionately impacted, Zabow says.
“This can be people with lower incomes, people who experience homelessness, but it can also be athletes, children under five,” she says.
With climate change those impacts are getting worse — meaning heat islands are all the more dangerous. Historically, Montgomery County has had about 19 days a year above 90 degrees, Zabow says. But that could rise to 68 days a year by 2050.
“As temperatures are increasing, that radiated heat from those buildings and roads is just going to get worse,” Zabow says.
With the heat island maps in hand, county officials hope to be able to better target programs to mitigate the problem.
Sivels says there is a menu of options — ranging from short-term education and awareness work, to longer-term efforts.
“It could be more tree plantings and shade. It could be better reflective services that don’t absorb the heat as much, and different elements of green infrastructure and urban planning to help combat these heat islands.”