The Urban Institute is out today with the second chapter in their Our Changing City series. The first focused on D.C.’s changing demographics, while this one focuses on how school choice and other factors have impacted the city’s public schools since 2000.
Below is a map that shows the relationship between the closing of public schools and gains at charters. DCPS is represented in blue, charters are in red.
The report comes as D.C. is in the process of potentially changing school boundaries and the student assignment process. One map particularly helpful in this discussion shows that, in 2012, nearly half of students traveled outside their Ward to attend school. Here’s Ward 8, for example, where the vast majority of students attend school where they live.
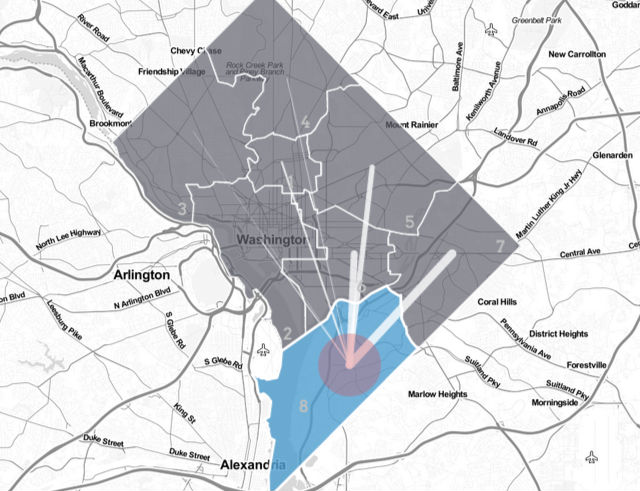 Via Urban Institute.
And finally here’s a map that shows the number of births to women with college degrees in 2003 …
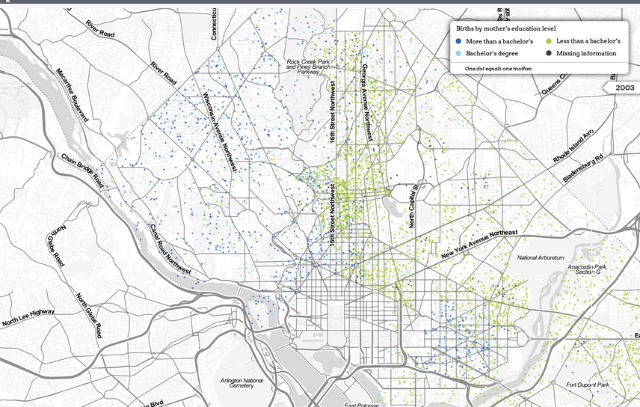 Via Urban Institute.
…versus 2011.
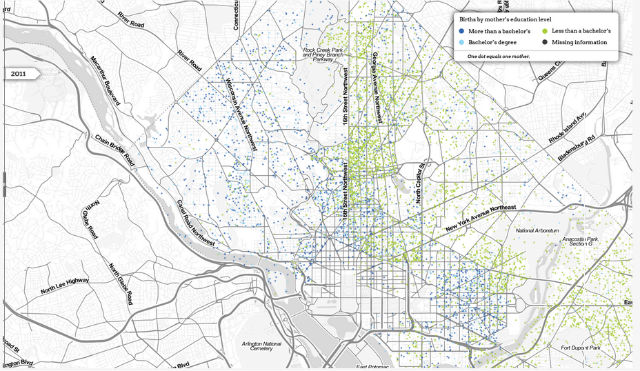 Via Urban Institute.
As the Urban Institute notes, DCPS enrollment is slowly ticking up, as charter schools continue to make gains.
Families staying in the city and choosing public schools is a real turnaround for D.C. Whether this trend can be sustained – or even accelerated – will shape the city’s future growth and vitality.