 Jordan Pascale
The State of the Washington Region Commute is… not great.
But you already knew that.
What you might not know is the average commute time is 43 minutes one way. And while people aren’t necessarily traveling farther than they used to, it is taking nearly 26 percent longer to get to work than it did just 15 years ago.
Every three years since 2001, the Regional Transportation Planning Board does one of its biggest surveys and releases its “State of the Commute” report. They send out postcards to randomly selected addresses. More than 8,200 workers across the region responded online and over the phone. This report specifically highlights commuting trips and doesn’t include non-workers, students and people just getting around to do errands. You can read the full 219-page report here (warning: links to large PDF).
Here are a few other facts and trends from the report.
1. Most drive alone
Nearly two-thirds of workers drive to work alone, but that number is down from three years ago. Transit and commuter rail make up about a quarter of commuters. And for the first time, commuters were asked about scooters and ride-hailing, each made up less than a percent.

A graph showing the primary mode of transportation taken by commuters in the Washington region in 2019.
2. Commute times make a difference in satisfaction
About 25 minutes separate those who are happy with their commute and those who are not.
The survey found that 80-90% of people who commute less than 20 minutes are satisfied.
Only about a quarter of people who commute over 45 minutes are satisfied.
3. Cyclist and walkers say they’re happiest with their commutes
A whopping 92% of pedestrians and cyclists say they’re satisfied with how they get to work. Libby Garvey of Arlington County Board says cycling could attract more people to the mode if there were more protected bike lanes.
Transit users are also happier than their driving companions.
Less than half of drivers are satisfied with their commute.

A survey of how satisfied people were with their commutes by mode of transportation.
The drop in driver satisfaction could be pegged to more congestion, longer commute times and the increasing number of tolls in the region.
4. Not commuting at all is making a big impact
Teleworking at least one day a week is at an all-time high of 35%. The federal government is one big reason — nearly half of federal workers surveyed say they occasionally work from home.
“They’re really the leaders in telework,” says Nicholas Ramfos, who presented the survey and heads Commuter Connections, a regional network of transportation organizations. “So we’d like to see more private sector and local and state government employers step up and allow for more teleworking.”
More people want to telecommute — the TPB estimates an additional 775,000 people would like to but can’t because their work doesn’t allow it or their job isn’t suitable for telework. That could make a drastic impact on roads and transit.
“Even if it’s one day a week, that 20% of your commute using an alternative form, you’re helping the region,” Ramfos said.
5. Ride-hailing numbers are small, but take away from transit
The survey included ride-hailing for the first time, but it only makes up about 1% of how people get to work.
Almost 60% of people who use ride-hailing apps said that if it wasn’t available, like pre-2011 D.C., they would take public transit. WMATA cites ride-hailing as one factor for decreased ridership but recently launched a partnership with Lyft to offer rider discounts.
6. The reasons why people left transit are…
Cost, time and unreliability were big factors. But the biggest reason people stopped using transit? They were left with limited or no transit options after their home or job changed. Only 17% of people in the region are within a mile of a Metro station, and only half live within a mile of a bus stop.
7. Distance from transit limits use

The report measured the relationship between transportation habits and the proximity of commuters’ homes to mass transit.
8. Income, racial demographics correlate with mode choice
Workers who make less than $60,000 use the bus at twice the rate of other income groups.
The survey also found that African Americans use the bus twice as much as people who are white.
Meanwhile, white people walked or biked three times the rate of black people.
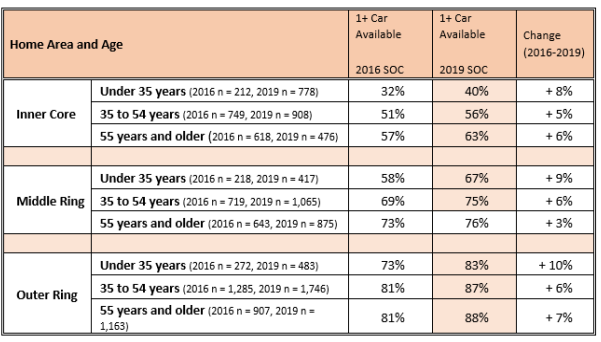
8. Vehicle ownership among young people is… up?
For a long time, the idea was that Millennials aren’t getting cars or drivers licenses, or at least getting them later. That appears to be reversing, Ramfos says.
Four in 10 people under 35-years-old now have at least one car available in the household — up 8% from three years ago. Those numbers are increasing even more in areas outside the District and in the outer parts of the region.
Marty Nohe, chair of the Transportation Planning Board, said that makes sense.
“Ten years ago we were told they weren’t going to buy cars … now they have families and buy cars,” Nohe said.
 9. Region split on driverless cars
Six in 10 surveyed said they’d heard about driverless cars, but don’t know much about them. A third said they’re very familiar with the idea.
People were more likely to list concerns about autonomous vehicles, like safety or privacy concerns, than benefits.
And about half said they weren’t interested in trying any sort of autonomous vehicle, whether it’s a driverless taxi, bus or privately owned vehicle.
10. HOV and express lanes don’t reach many
Transportation departments have been selling HOV lanes and express toll lanes as a way to change driver behavior and encourage carpooling. But only a third of those surveyed say their commute routes have HOV lanes and only 18% have access to express lanes. Even fewer said they use them if they are available.
This story originally appeared on WAMU.