Rachel Kurzius

Last decade began with the revelation that D.C. was no longer technically Chocolate City.
While black Washingtonians comprised 71 percent of the District in 1970, that number had fallen to 49.2 percent by 2011 (and the percentage of African-American residents has continued to decline since then).
And as the District has become less black, the surrounding suburbs have grown significantly less white.
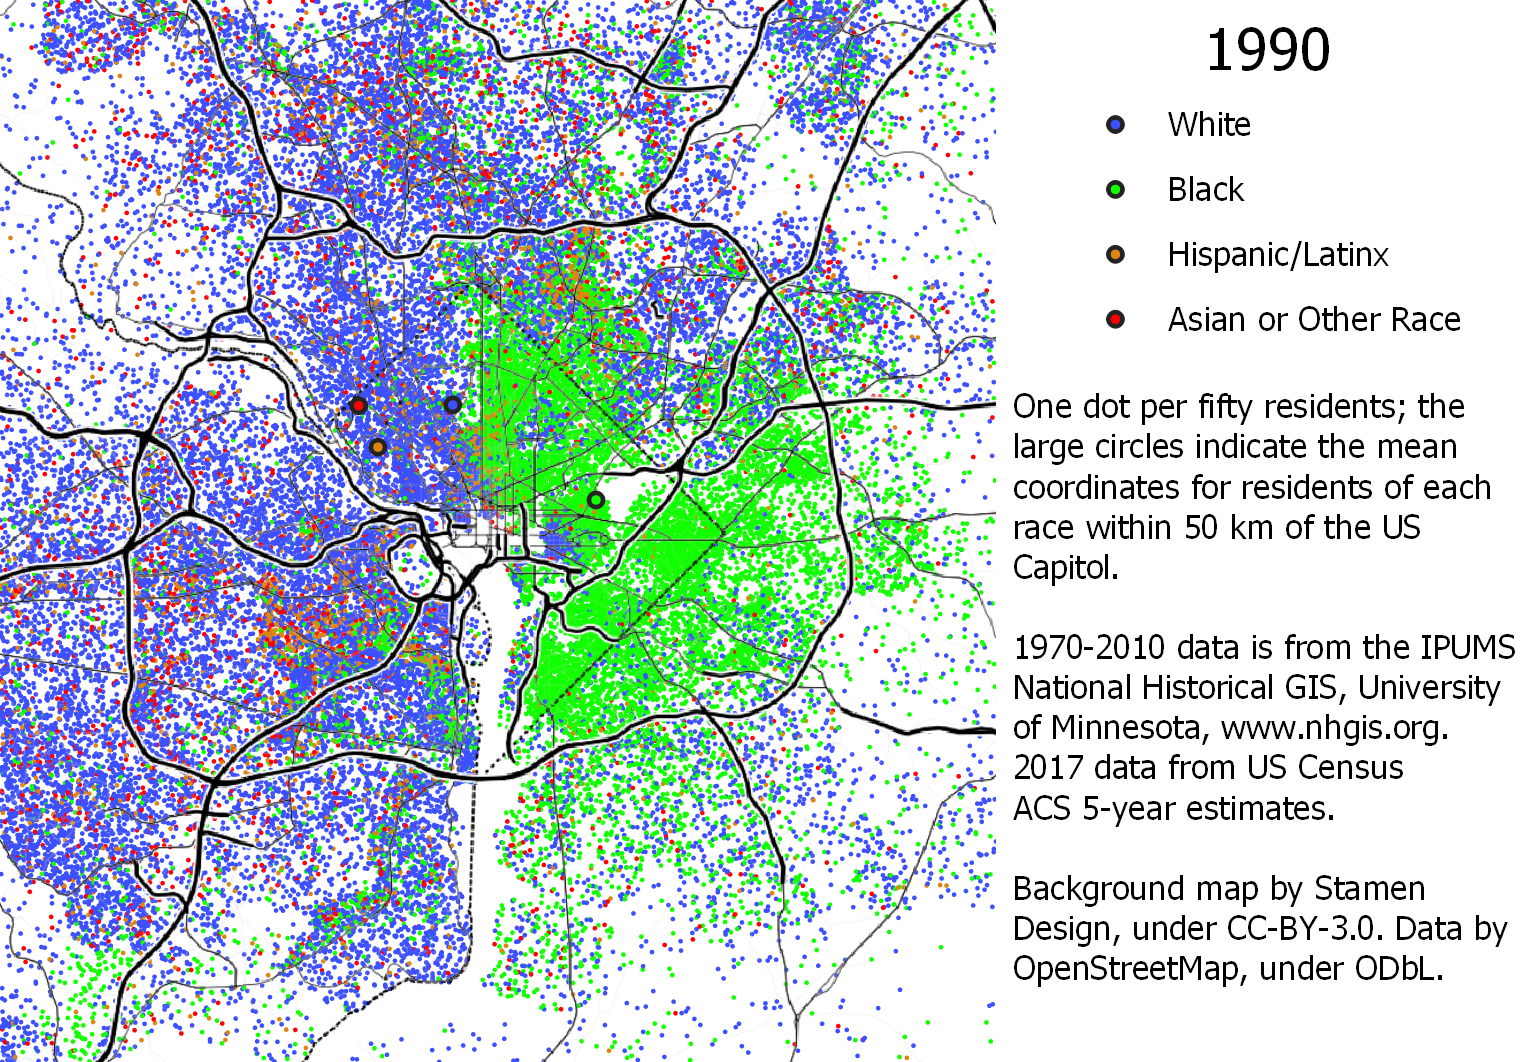
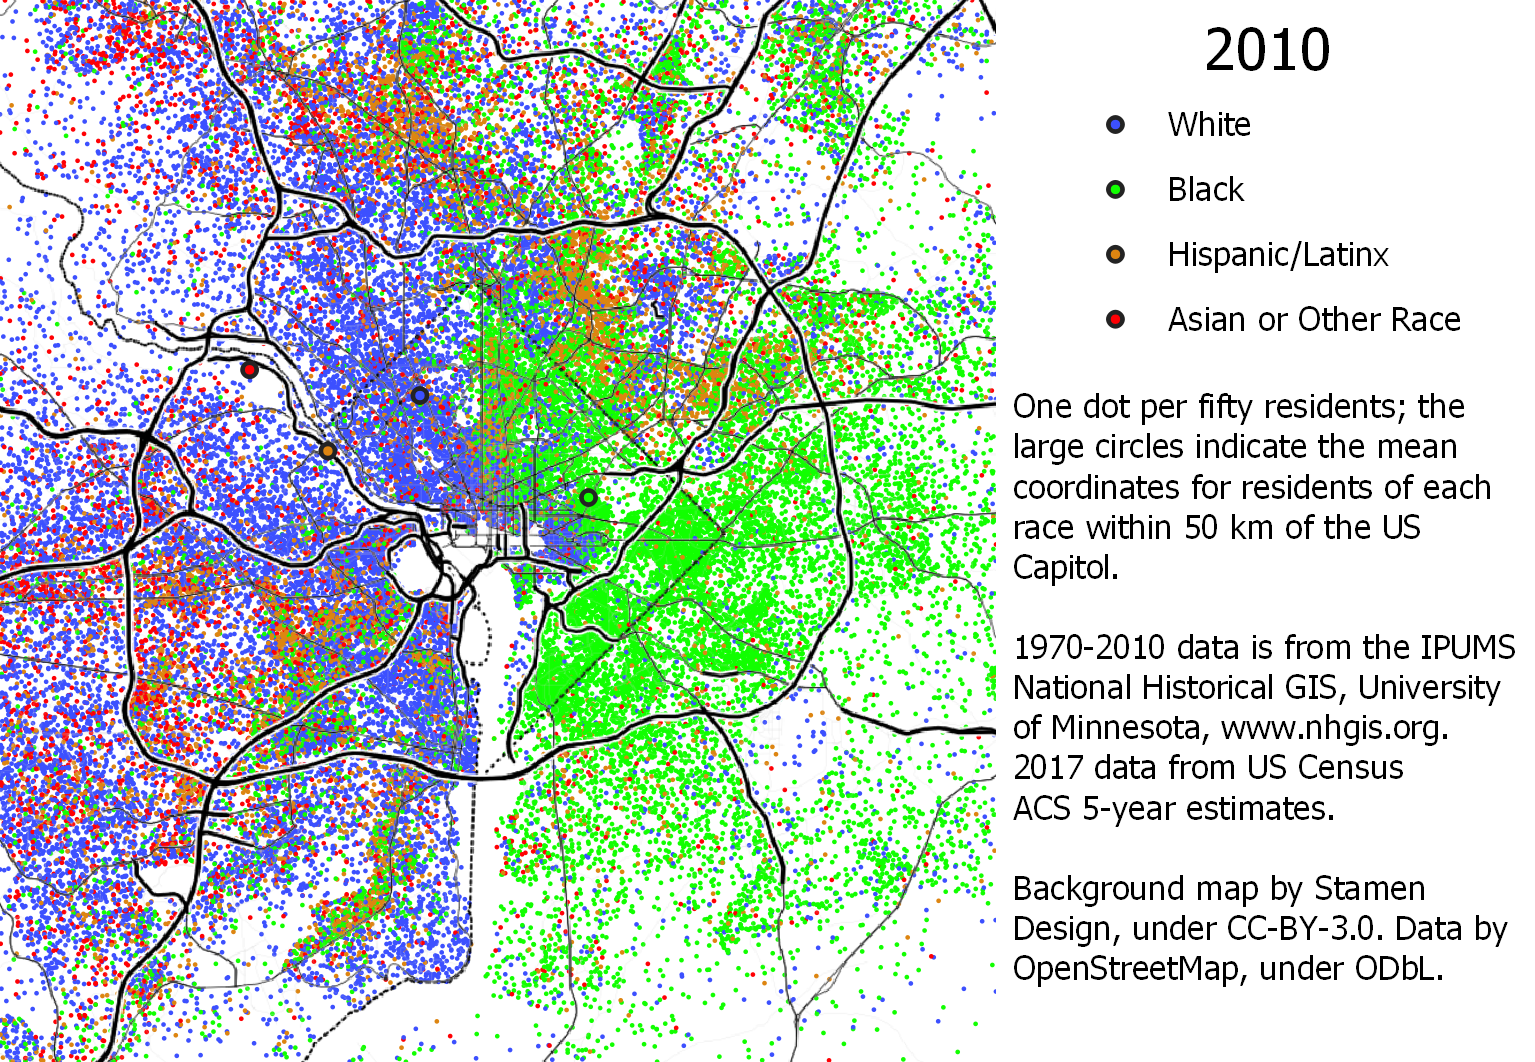
A new analysis published by the D.C. Policy Center visualizes just how the broader area’s demographics have changed over the past half-century or so.
“In 1970, almost everyone lived in a neighborhood that was either entirely black or entirely white,” says D.W. Rowlands, a human geography graduate student at University of Maryland, Baltimore County. “And now, west of 16th Street, most areas are pretty racially mixed. East of 16th Street, there are still some pockets that are almost entirely African American. But there’s a lot more mixing of different groups than there used to be.” (16th Street NW runs along a large swath of Rock Creek Park, which for decades served as a divider of race and class.)
Rowlands used census data from 1970-2010, as well as 2017 data from the U.S. Census Bureau’s American Community Survey, to determine where people of different racial backgrounds live. The next census is slated for this year, as it occurs each decade, and Mayor Muriel Bowser has allocated grant money to ensure that so-called hard-to-count populations get counted.
In the maps Rowland made, the colors standing in for the four categories represented (white, black, Hispanic, and Asian or other race) have grown far more dispersed since 1970.
These demographic changes were also happening as the overall population of the District has shifted: After peaking with a population of more than 900,000 in 1943, D.C.’s population began a decline until 2000. The city hit 700,000 residents this year (the last time D.C. was this populous was in 1975).
While less visible in 1970, Hispanic populations become visible on the maps near Columbia Heights in D.C. and Langley Park in Maryland around 1990. On that same 1990 map, a substantive Asian population is visible in Fairfax County.
“The end of legal segregation and of some of the more blatant redlining techniques has made it more practical for minorities to move into neighborhoods that previously were effectively maintained as inaccessible to them,” says Rowland.
But it’s not just people choosing to move. “Some of the suburbanization is presumably caused by the fact that property values in a lot of the city are rising and rents are rising,” says Rowland. “So people who previously lived in more urban areas are finding they can’t afford to live there.”
Indeed, a study released by the Institute on Metropolitan Opportunity last April found that D.C. was among the few cities in the country where economic growth was resulting in displacement of low-income populations. From 2000-2016, more than a quarter of low-income people who lived in District neighborhoods experiencing economic expansion were displaced. As far as demographics go, those neighborhoods (think Shaw, Columbia Heights, Bloomingdale, Brookland, and Edgewood, for starters) saw a decrease in their black population by 23 percent, along with a 202 percent increase in their white population.
The study noted that the suburbs surrounding D.C. were seeing the opposite: a growing population of low-income residents.


There’s No Paywall Here
DCist is supported by a community of members … readers just like you. So if you love the local news and stories you find here, don’t let it disappear!